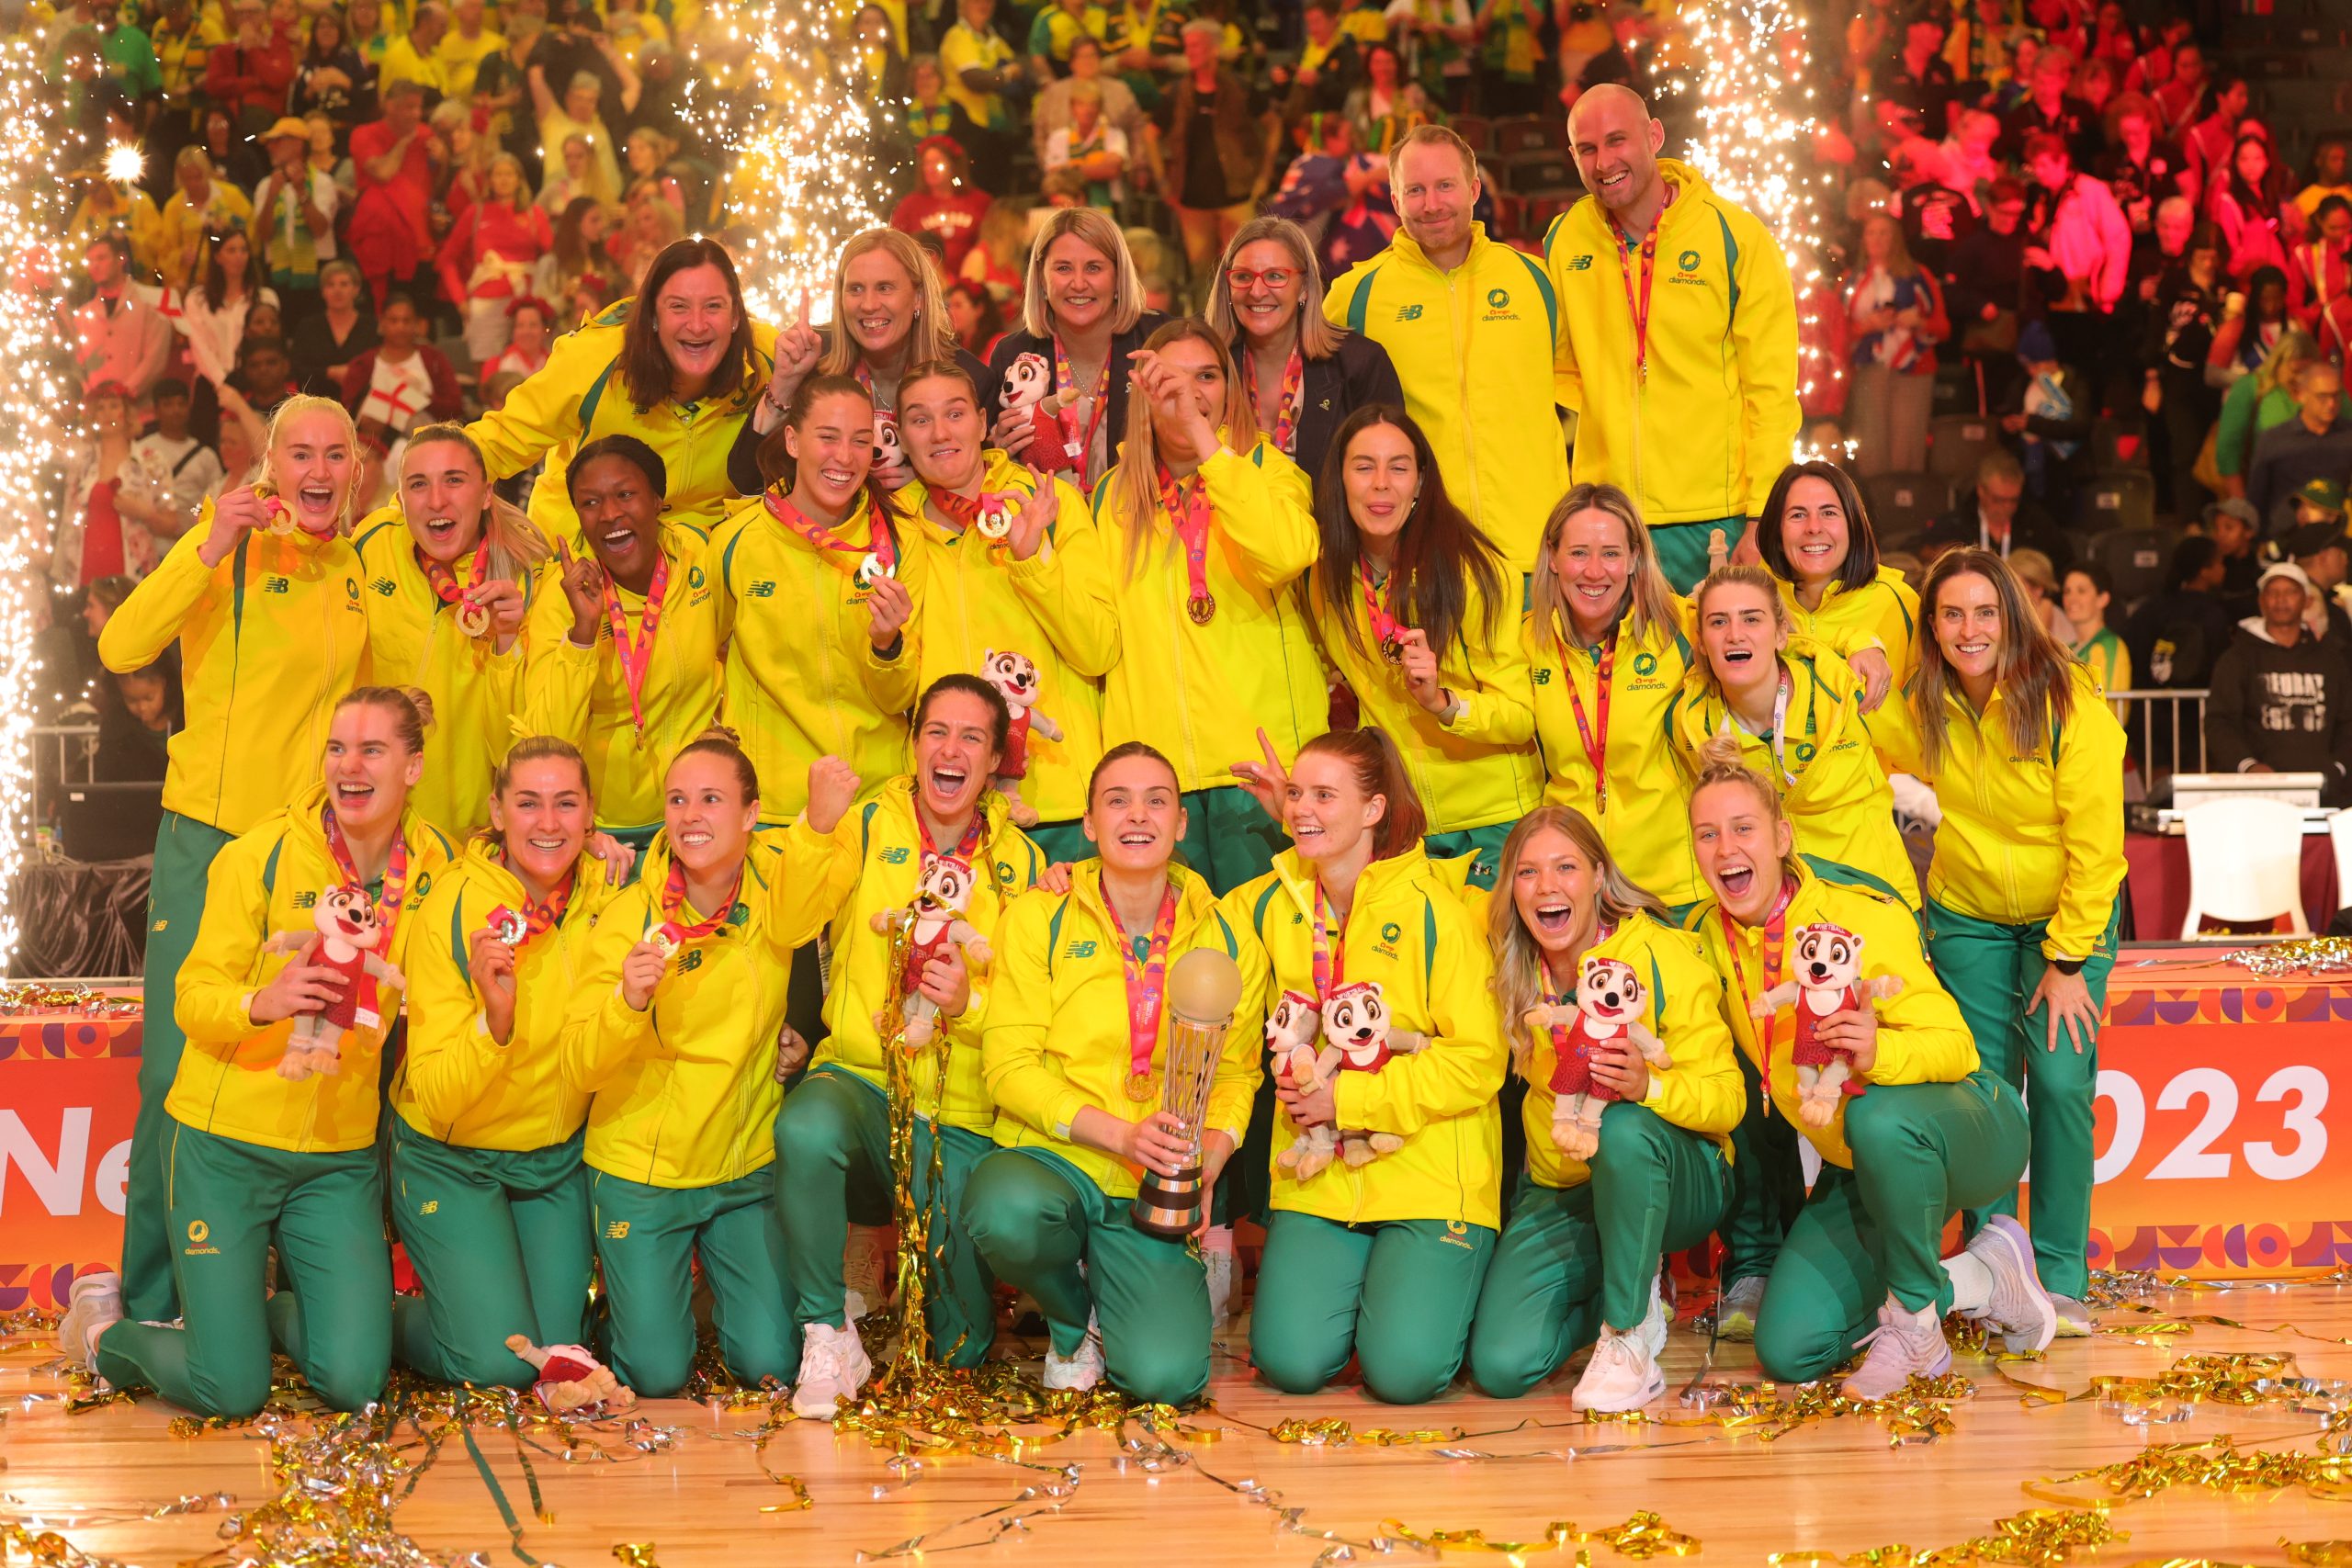
We’re not far away from more international action, so it’s an excellent time to review some of the statistics from the recent Netball World Cup. What a tournament it was. Australia came away the victors for the 12th time, but there were some tremendous results from other nations, while some countries perhaps didn’t quite perform up to expectations.
Please note that this article uses the statistics for the World Cup as supplied by Champion Data. Rather than looking at individual stats, this is a review of the teams’ overall stats to see if we can spot where particular nations succeeded and where they fell down. You will notice in the following graphs, we’ve included the finishing positions of each nation, so that we can compare them with their ranking in each category.
We’ve also separated the bottom four nations from the rest. After day three in Cape Town, Zimbabwe, Barbados, Singapore and Sri Lanka, were relegated to their own group. As a result, the standard of competition those four nations faced for the duration of the tournament was significantly lower than the rest, so it would not be an even comparison to put them up against the top 12 teams.
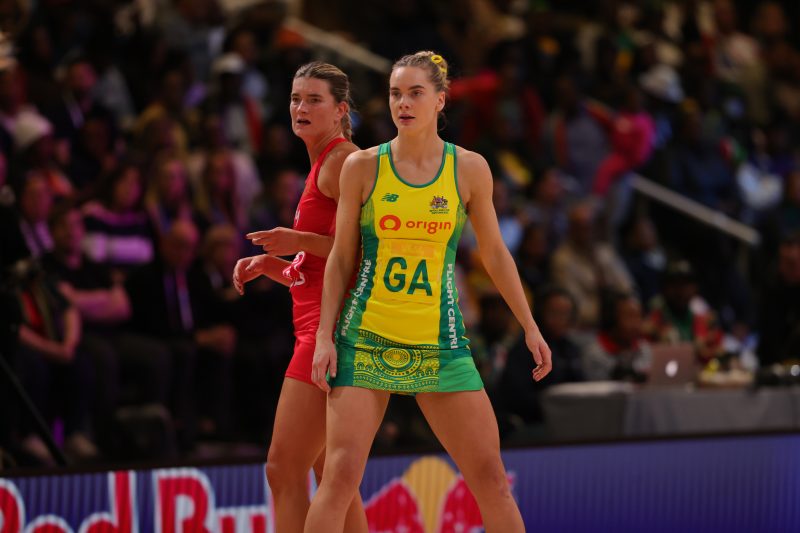
Australian shooter Kiera Austin was a deserved MVP of the gold medal match. Image: Danny Dalton
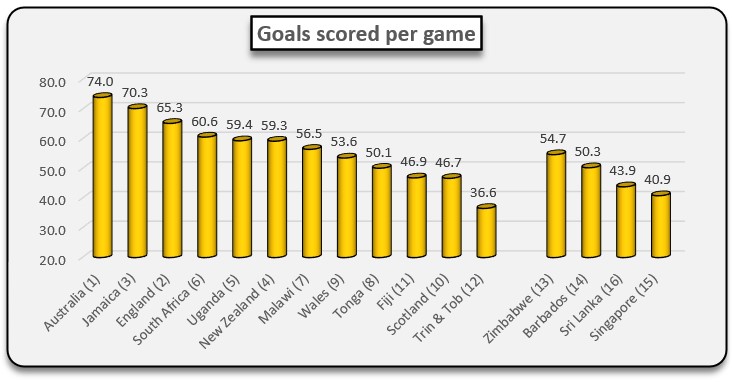
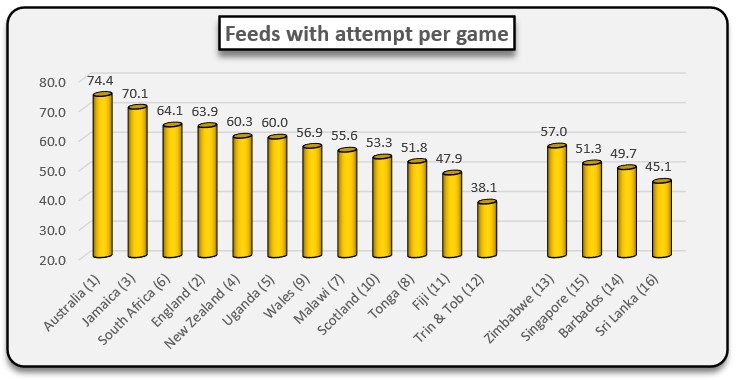
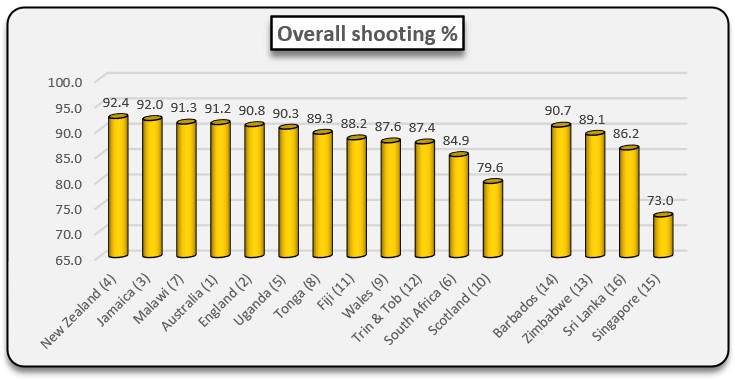
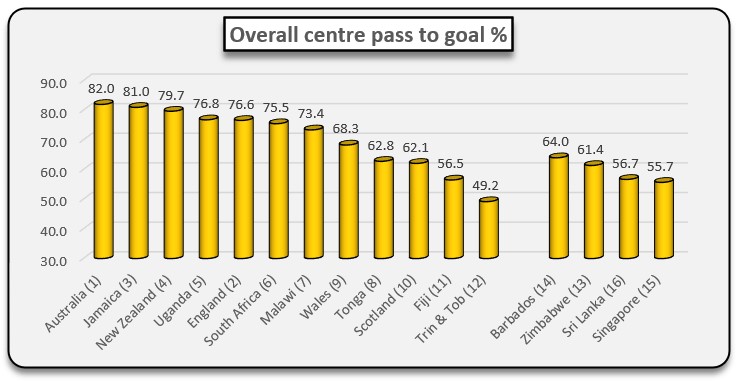
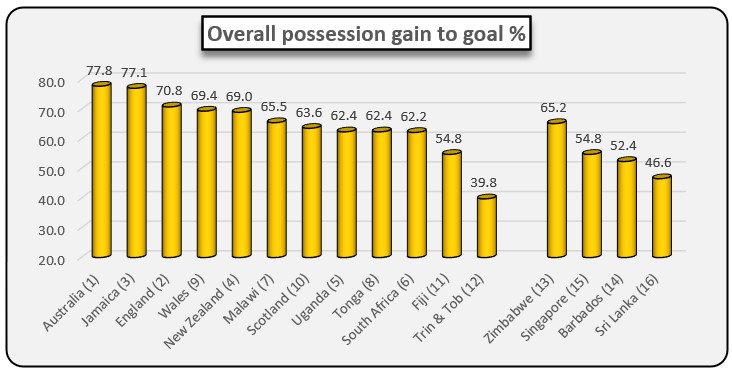
Firstly, we will look at attacking stats to see which teams were most prolific and efficient with ball in hand. It won’t surprise many to see that the gold medal winning Australian team led most categories here. Put simply, they scored the most goals and made the fewest mistakes. A perfect example of their teamwork and proficiency was in the final.
Bench shooters Kiera Austin and Sophie Garbin were introduced at a time when the game was right in the balance, and not only did they not miss a beat, they proceeded to dominate the circle with Austin picking up the match MVP. Meanwhile, midcourters Liz Watson and Paige Hadley combined for 35 assists and just two turnovers in 60 minutes.
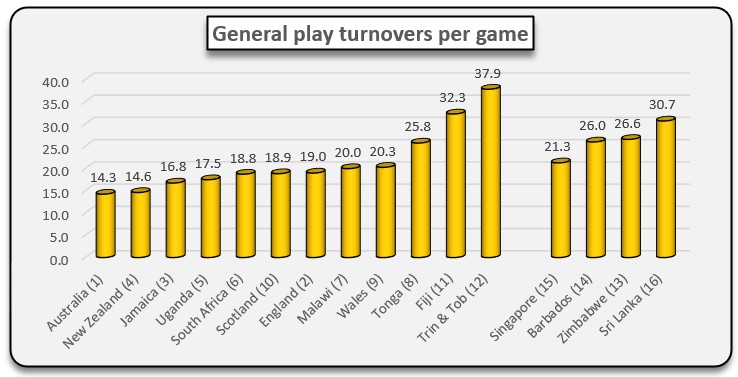
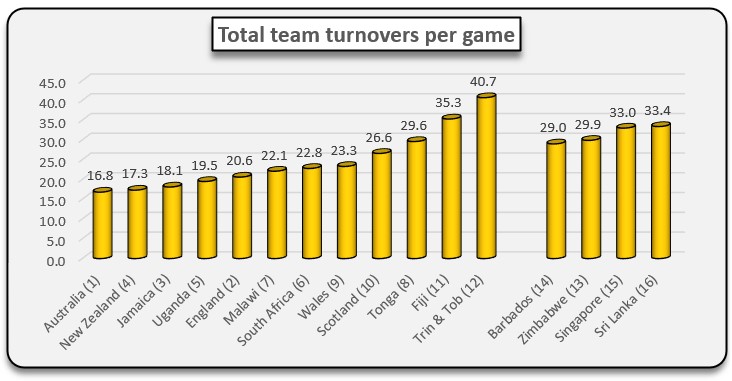
Maybe most surprising when looking at the attacking stats is that silver medallists England finished further down the list than you might expect in some categories. In particular, they ranked only seventh when it came to general play turnovers. Turnovers proved to be a real problem in the gold medal game where England lost possession 25 times in total compared to the Diamonds’ 15.
That was very different to the group game between the two teams when England had one less turnover than Australia. Despite that sometimes inconsistent display in attack from the Roses, shooter Helen Housby had an outstanding World Cup and was named player of the tournament.
Unsurprisingly, bronze medallists Jamaica performed well in attack. They were the only team to finish top three in every one of these attacking categories, and with captain Jhaniele Fowler topping the tournament goal scorer charts with 302/310 at 97.4%, it’s not hard to see why. Jamaica was behind only Australia when it came to converting possession into goals.
Losing one of the world’s best goal shooters, Grace Nweke, definitely had an impact on New Zealand. The Silver Ferns finished just sixth in terms of number of goals scored per game, and missed a medal for the first time at a World Cup. Some of the other attacking stats here are perhaps a bit misleading as they show that the kiwis were actually quite effective overall in converting the possession they had during the tournament.
The big problem was that without Nweke, the Ferns were quite laboured and hesitant with the ball and found it increasingly difficult to score when up against their strongest opposition. In their last four games (against South Africa, England, and Jamaica twice), New Zealand failed to score 50 goals on each occasion and came away with just one draw and three losses.
The surprise packets, Uganda, showed their fifth placing at last year’s Commonwealth Games was no fluke, by repeating the dose in Cape Town, and a lot of that was down to the She Cranes’ lack of errors in possession. They finished an impressive fourth in general play turnovers, total turnovers, and centre pass to goal percentage. One statistic that may surprise some is that Uganda was the only team in the tournament to have over 50% share of possession in every game they played.
South Africa was prolific in attack, finishing fourth in terms of goals, but shooting accuracy and gain to goal percentage were both problems for them compared to some of the other top nations. Of the teams further down the list, Scotland and Singapore’s shooting percentages were also lower than they would have wanted, while Trinidad & Tobago really struggled badly. It must be remembered that for the second major tournament in a row, the Calypso Girls were without their star shooter Sam Wallace and her absence leaves a huge hole in this team.
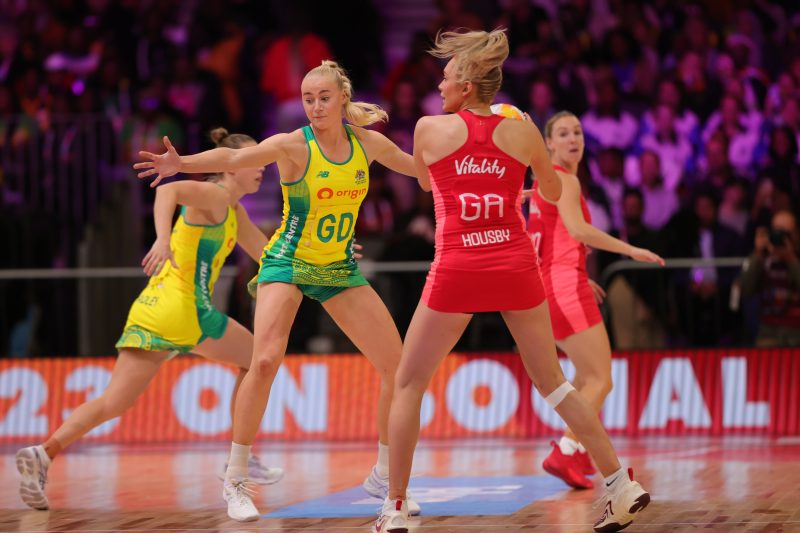
Player of the tournament, Helen Housby. Image: Danny Dalton
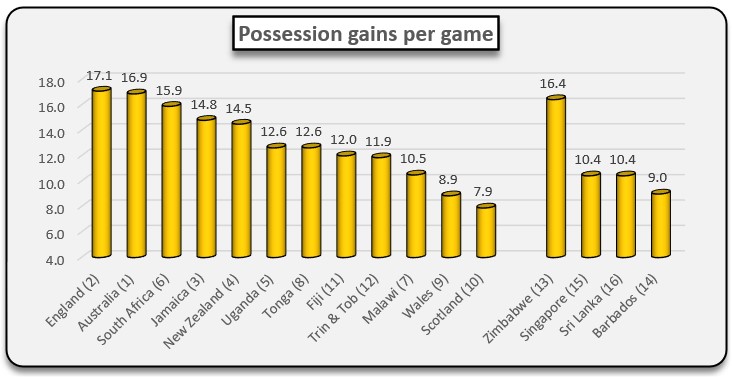
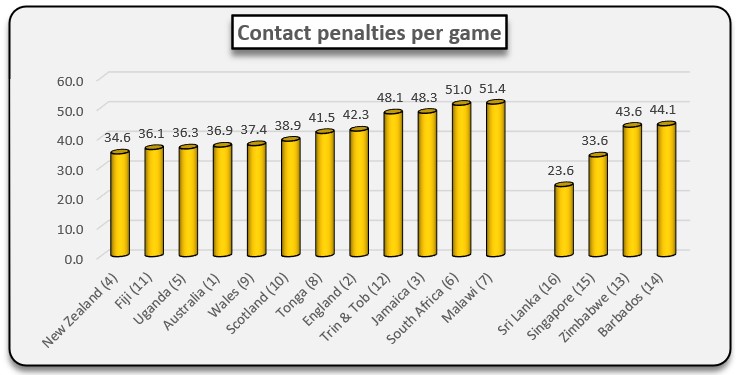
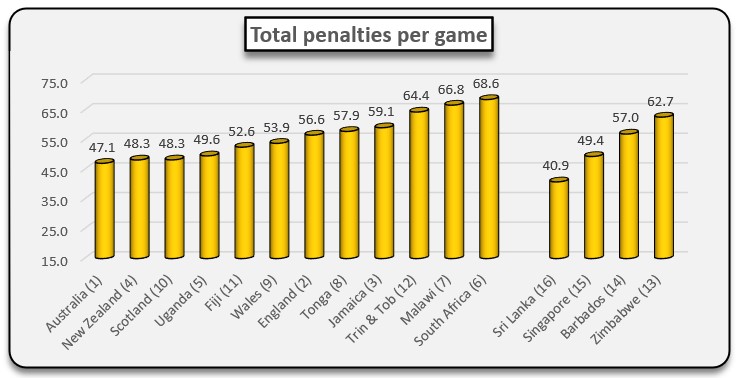
Now we move onto the defensive categories. The two finalists, Australia and England, both performed very well here. England finished the tournament just pipping Australia when it came to possession gains. It was a genuine team effort for the Roses with a handful of players all contributing and nobody standing out, although goal defence Fran Williams and midcourter Imogen Allison came up with some big plays at important moments. One area where the Roses fell down slightly was in penalties, conceding almost 10 more per game than Australia.
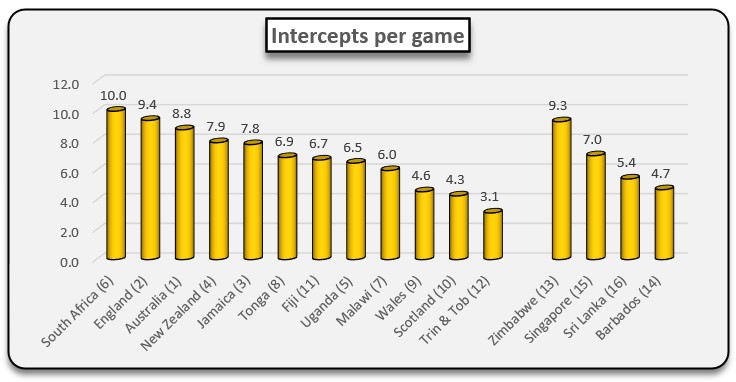
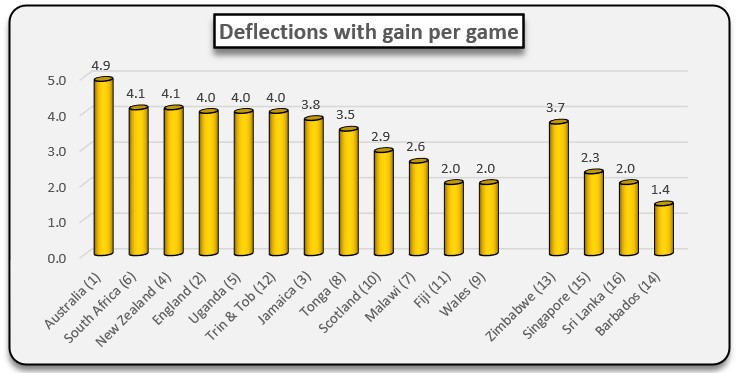
Diamonds goal keeper Courtney Bruce was voted the defender of the tournament, finishing at or near the top for deflections and intercepts. And she was the difference when the finals came round with two spectacular performances, firstly against Jamaica in the semi final, then against England in the final.
It was interesting that Bruce had little effect in the group game against England, with the Roses shooters successfully keeping her from having an influence. She finished without a single possession gain, and that clearly spurred her on to greatly improved showings in the next two matches.
It was perhaps surprising that Jamaica wasn’t more dominant defensively. Leading into the World Cup, everyone was wary of the quartet of Shamera Sterling, Latanya Wilson, Jodi-Ann Ward and Kadie-Ann Dehaney. While they had their share of successes during the tournament, it seemed that they just didn’t quite get going as most had predicted. The Sunshine Girls ended up finishing outside the top three in all of the defensive categories shown below.
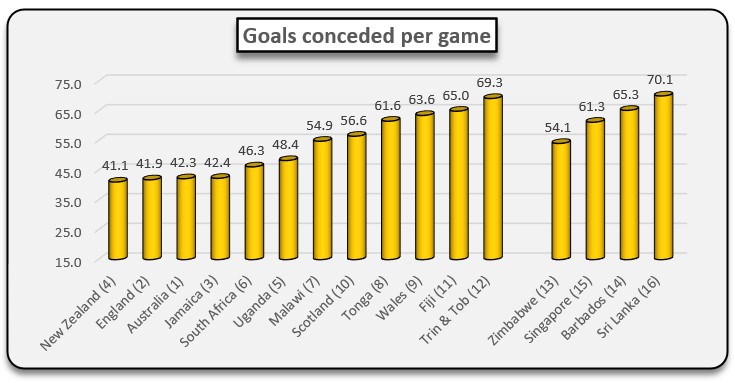
As mentioned when discussing the attacking stats, New Zealand found it difficult to score after Nweke’s injury. One side effect of that was that it actually left their opponents less time to score as well. As a result, the Silver Ferns’ defence actually conceded the fewest goals per game of any team in the tournament. They were also good at remaining in play, giving up just over 48 penalties per game.
It was a real mixed bag for sixth placed South Africa. On one hand their defence, led by goal keeper Phumza Maweni, came up with a lot of ball, leading the intercepts category and tying for second in deflections with gain. But then there were the penalties. The Proteas finished the World Cup as the most penalised nation, and Maweni in particular was on the receiving end.
In the all-important playoff for 5th and 6th, South Africa gave away 82 penalties to Uganda’s 49. Maweni was responsible for 22 of those to go with her five possession gains. By contrast, Uganda proved to be one of the least penalised teams at the World Cup, with 19 penalties per game less than their African rivals.
Of the bottom four teams, Zimbabwe proved to be a real highlight in defence, with exciting players like Elizabeth Mushore and Felisitus Kwangwa leading the Gems to an excellent 16.4 possession gains per game. Defensively, they dominated the other three teams in group E. Meanwhile, Sri Lanka ended the tournament with clearly the least penalties of any team.
So, there we have it for another four year cycle. Australia is on top for now, but so much is changing. The gaps are closing. England and Jamaica will be a constant threat, and New Zealand are sure to come back hard after this disappointment. Then there is South Africa, Uganda, Malawi, Tonga, and more. The depth of international netball is improving all the time.
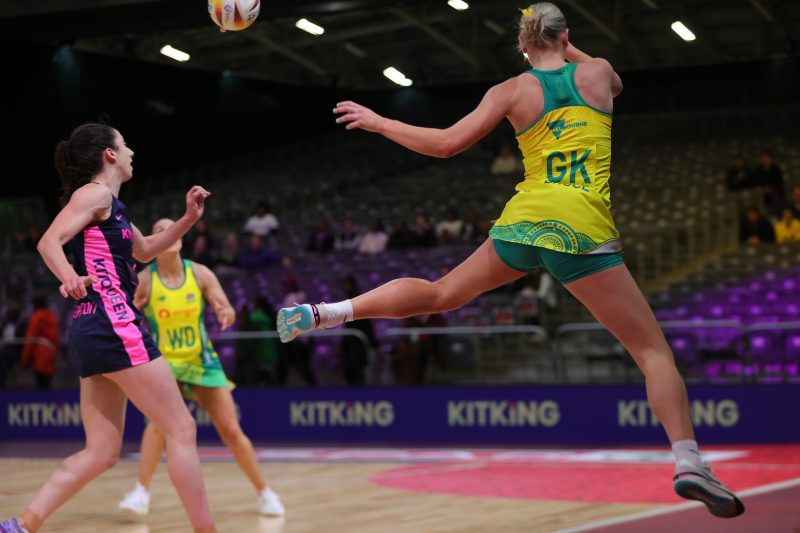
Diamonds defender Courtney Bruce was the defender of the World Cup. Image: Danny Dalton

